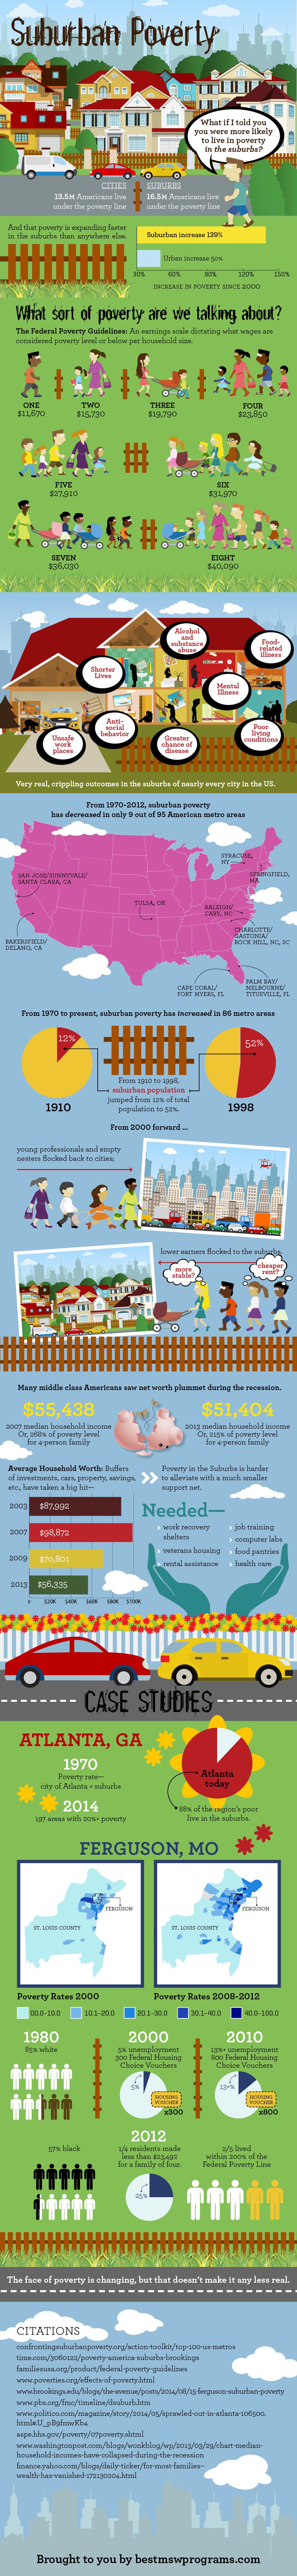
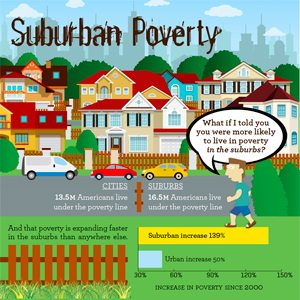
Suburban Poverty
What if I told you you were more likely to live in poverty living in the suburbs.
Suburbs: 16.5 Million Americans live under the poverty line [2]
Cities: 13.5 Million Americans live under the poverty line
And that poverty is expanding faster in the suburbs than anywhere else.
Increase since 2000:
Suburban: 139%
Urban: 50%
What sort of poverty are we talking about?
The Federal Poverty Guidelines:
An earnings scale dictating what wages are considered poverty level of below per household size.
[#household size || Federal Poverty Level][3]
1 || $11,670
2 || $15,730
3 || $19,790
4 || $23,850
5 || $27,910
6 || $31,970
7 || $36,030
8 || $40,090
Leading to:[4]
Alcohol and substance abuse
Unsafe work environments
Poor living conditions
Heightened chance of disease
Food-related illness
Shorter Lives
Shrunken Brains
Mental Illness
Anti-social behavior
Very real, crippling outcomes.
In the suburbs of nearly every city in the US.
Of 95 American metro areas, suburban poverty has only decreased in 9 areas:[1]
Syracuse, NY
Springfield, MA
Tulsa, OK
San Jose-Sunnyvale-Santa Clara, CA
Charlotte-Gastonia-Rock Hill, NC-SC
Bakersfield-Delano, CA
Cape Coral-Fort Myers, FL
Palm Bay-Melbourne-Titusville, FL
Raleigh-Cary, NC
From 1970-2012
The Story: [6]
From 1910 to 1998, suburban population jumped from 12% of total population to 52%.
From 2000 forward, young professionals and empty nesters flocked back to cities.
Lower earners flocked to the suburbs.
Factors: cheaper rent. image of stable suburbs.
Many middle class Americans saw net worth plummet during the recession.
Adjusted Household Income:
2007: $55,438 (268% of Poverty Level for 4 person family).[8][9]
2013: $51,404 (215% of Poverty Level for 4 person family).[8][9]
Average Household Worth:
(Investments, cars, property, savings)[10]
2003: $87,992
2007: $98,872
2009: $70,801
2013: $56,335
Poverty in the Suburbs is harder to alleviate
With a much smaller support net.
“Work recovery” shelters, veterans housing, rental assistance, job training, computer labs, health care, food pantries are needed.
Case Studies
Atlanta[7]
1970:
Poverty rate equal in city of Atlanta and suburbs.
Today:
197 areas with 20%+ poverty
88% of the region’s poor live in the suburb.
Ferguson, MO:[5]
1980: 85% white
2000: 5% unemployment
2000: 300 Federal Housing Choice Vouchers
2010: 13%+ unemployment
2010: 800 Federal Housing Choice Vouchers
2012: 57% black
2012–
1/4 residents made less than $23,492 for a family of four.
2/5 lived within 200% of the Federal Poverty Line
The face of poverty is changing, but that doesn’t make it any less real.
Citations:
- http://time.com/3060122/poverty-america-suburbs-brookings/
- http://familiesusa.org/product/federal-poverty-guidelines
- http://www.poverties.org/effects-of-poverty.html
- http://www.brookings.edu/blogs/the-avenue/posts/2014/08/15-ferguson-suburban-poverty
- http://www.pbs.org/fmc/timeline/dsuburb.htm
- http://www.politico.com/magazine/story/2014/05/sprawled-out-in-atlanta-106500.html#.U_pB9fmwKb4
- http://aspe.hhs.gov/poverty/07poverty.shtml
- http://www.washingtonpost.com/blogs/wonkblog/wp/2013/03/29/chart-median-household-incomes-have-collapsed-during-the-recession/
- http://finance.yahoo.com/blogs/daily-ticker/for-most-families–wealth-has-vanished-172130204.html